

SYSTEM RESEARCH
In order to be able to create an efficient sizing software for a solar hydrogen system, Vision H2 carried out extensive and detailed research alongside experiments. This section details how relationships between and values taken for components were established in order to create and validate the tool.
System Background Research
The concept of a district electricity system that can provide reliable power at any time, is similar to the well-established concept of district heating. A system whereby the electricity is generated locally and on demand, would require a large scale and long-term energy solution. Upon research, Vision H2 determined that hydrogen could be that long-term future solution, as discussed in the 'Why Hydrogen?' section and so began reviewing previous research on systems that incorporated hydrogen storage with renewable energy sources.
Solar-hydrogen storage systems have been tested on an experimental and demonstration scale worldwide in order to assess its feasibility, however they have yet to be deployed on a large scale. Research carried out for various configurations of a solar-hydrogen system concluded that this system may be economically feasible by the year 2015 (Lagorse et al., 2008). Research has also been carried out whereby the system harnesses wind energy or a combination of both. In this case, harnessing solar energy was pursued for the tool development however it was determined early on that this tool would be adaptable to future renewable energy source additions such as wind.
Software such as Matlab or Simulink have been utilised in modelling and determining the feasibility of such systems however the H2ool was designed with the desire to have a unique and conclusive sizing capability for this type of system.
PV Research
With renewable energy comes a source intrinsically stochastic hence the group set out to develop a model adaptable to this.
How does a PV Panel works?
PV panels are mostly made out of monocrystalline silicon which is a
semiconducting material.
The process of current production is based on a p-n junction. When
light falls on the cell, photons create electron-hole pairs on both
sides of the p-n junction.
After some time a negative charge develops in the emitter and a
positive charge in the base.
If a circuit is connected to the emitter and base a current flows.
How is the PV incorporated into the H2ool?
We have developed a full trigonometric PV model where a user can input irradiance data specific to his/her location and the model will generate the annual hourly energy output of a specified PV area.
The following paragraphs will explain in technical detail how the trigonometric model has been developed and works.
First of all it is important to know where the system would be located. Depending on the
location (Figure 2) and the local time the irradiance data, solar position and solar angles differ.
Therefore the first inputs are:
-
Location
-
Latitude and Longitude
-
Local time Zone
The model is based on an hourly overview of a full year.
There are two different types of solar radiation possible, direct or diffuse solar radiation,
which can be seen in the pictures below.
Since the power output of a PV panel is dependent on the type and the amount of direct or indirect radiation the second part of the required input data is
-
Direct normal solar radiation (W/m^2)
-
Diffuse horizontal solar radiation (W/m^2)
Depending on the daytime (Figure 5) and month (Figure 6) the solar radiation falls in different angles on the earth. Therefore, the trigonometric model takes first of all the day in the year into account and calculates the declination, d (deg) and the equation of time, E:
d = 23.45 * sin (280.1 + 0.9863 Y)
E = 9.87 sin(1.978Y - 160.22) - 7.53 cos(0.989Y - 80.11) - 1.5 sin(0.989Y - 80.11)
where Y = day number of the year
(e.g. January 1 =1, December 31 = 365)
Using the equation of time the local solar time, ts can be calculated. "This is a time that relates to the apparent angular motion of the sun across the sky vault, with solar noon corresponding to the point in time at which the sun traverses the meridian of the observer." (Clarke and Kelly, 2017).
ts = (tm ± time zone) ± LG/15 + E/6
where tm = Local clock time
LG= longitude
Knowing the these parameters allows the calculation first of the solar altitude(deg), then solar azimuth (deg) and finally the incidence angle (s. Figure 7) can be calculated with:
solar altitude:
βs = sin-1 [cos LT cos d cos θh + sin LT sin d ],
where LT = latitude
θh is hour angle,
θh = 15 (12 – Solar local time)
solar azimuth:
αs = sin-1 [ cos d sin θh / cos βs ]
incidence angle of direct beam:
iβ = cos-1[ sin βs cos (90-βf ) + cos βs cos ω sin (90-βf )],
where ω = surface-solar azimuth
βf = surface inclination angle
surface-solar azimuth (deg) = |αs - αf |
where αs is the solar azimuth
and αf is surface azimuth
Assumption: The surface azimuth is 180 deg.
Inclined surface irradiation
In order to calculate the total radiation incident on an exposed surface of inclination βf and azimuth αf is consistent of three different radiation types which are:
-
direct,
-
surroundings-reflected and
-
sky diffuse.
Assuming an isotropic sky, the unknown solar quantities are calculated using the angles carried out before.
To calculate the direct radiation on a surface of inclination (W/m^2) on the PV panel the following formula has been used:
Idβ = Idh cos iβ /sin βs,
where Idh is the direct horizontal intensity (W/m^2 )
Then the sky diffuse radiation incident on a surface of inclination (W/m^2) is calculated using:
Isβ =Ifh{0.5[1+cos(90-βf)]} (isotropic sky)
Finally also the ground reflected radiation incident on a surface of inclination, Irβ (W/m^2) is taken into account with:
Irβ = 0.5 [1 - cos (90 - βf)]( Idh + Ifh)rg
In the end all solar irradiance types are summed up in order to evaluate the total solar irradiance power, ITOT, on the PV panel (W/m^2). With that information the PV panel power output can be determined, using equation:
Power output = PSTC x (ITOT/1000) x A
where A = area,
PSTC is the power output at Stantard Test Conditions (1000W/m^2 & 25°C). This model assumes a constant temperature but this can be altered.
In order to find the day with the average daily PV output, the hourly PV power is summed up over the day.
The average daily PV output can then be matched to the power required by the system. That results into the required PV area given in m^2 and peak power output in W.
Limitations
The temperature of the panels was not considered in these calculations. Environmental issues, such as dust gathering on the PV panels were also not accounted for.

Figure 1: PV Panels (energysage, n.d.)

Figure 3: Direct solar radiation (Clarke and Kelly, 2017)

Figure 4: Diffuse solar radiation (Clarke and Kelly, 2017)

Figure 2: Latitude and longitude (Clarke and Kelly, 2017)

Figure 5: Solar time (Clarke and Kelly, 2017)
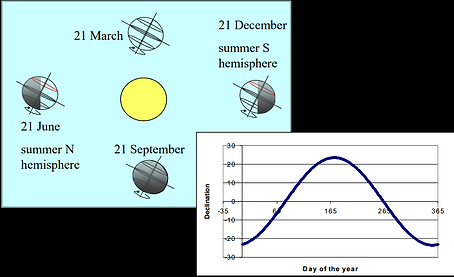
Figure 6: Solar declination (Clarke and Kelly, 2017)

Figure 7: Solar geometry (Clarke and Kelly, 2017)
Electrolyser Research
How does an Electrolyser work?
The Electrolyser takes the DC power supply from the PV panels in order to produce hydrogen by electrolysis. As can be seen in Figure 8, the electrolyser splits water into hydrogen and oxygen by electrolysis. In theory, from 1L of water, 1.24m3 of hydrogen can be produced however in reality around 25% extra can be expected to be required (Barbir, 2005). Then, for every two moles of hydrogen produced, 1 mole of oxygen is produced.
As of just now, the market consists of predominantly alkaline electrolysers however PEM electrolysers are anticipated to hold the most promising future particularly in terms of large scale application due to their continuous decrease in price whilst offering a more efficient performance. Nel Hydrogen is one of the global industry leaders in electrolysers with a range of highly efficient alkaline water electrolysers that manage a hydrogen production rate of 3.8 (kWh/Nm3) (Nel Hydrogen, 2018); the company added PEM electrolysers to their portfolio in 2017. Research suggests that industrial PEM electrolysers typically have an electricity consumption between 4.5-6.0 (kWh/Nm3) (Barbir, 2005).
How is the electrolyser incorporated into the H2ool?
Various issues arise in operating a PEM electrolyser coherently with renewable energy sources. Most notably and one of the greater challenges for the tool was to size the electrolyser relative to the PV array size; for this, it was determined that the tool had to size the component iteratively in respect to both the demand and the stochastic source. It was desirable to design the tool in order to determine an optimum electrolyser capacity for any given irradiance (PV availability) and demand profile.
The voltage and current by which the electrolyser is supplied electricity to perform electrolysis is intrinsic to its efficiency. For this, the connection and control between the PV array and electrolyser is imperative to improving the system however has to be considered in line with the capital cost of the system. Operating the electrolyser at high temperatures (typically 60-80degrees) and high pressures (>25bar) could increase the efficiency of the component however it must be considered along with the level of hydrogen permeation this leads to.
Whilst these are all important factors for the electrolyser, the investigation was limited in the case of developing the tool and a value of 4.5 (kWh/Nm3) was taken and implemented for the energy required for hydrogen production.
Figure 8: Electrolysis process
Fuel Cell Research
How does a Fuel Cell works?
A fuel cell is a device that converts chemical energy into electrical energy.
The project takes a PEM (proton exchange membrane) fuel cell into account that uses hydrogen and oxygen as a fuel.
The PEM fuel cell consists of an anode (negative part), a cathode (positive part) and an electrolyte that is the membrane itself. When hydrogen is flowing into the fuel cell, the hydrogen molecule splits into two H+ ions and two electrons (e-) as soon as they reach the membrane. The electrons are directed through the anode to an external circuit to produce electricity before they arrive at the cathode. On the cathode side, negatively charged oxygen atoms attract the positively charged H+ ions and form with the arriving electrons water molecules (H2O).
To size the fuel cell some experimental data was gathered in the Strathclyde’s Fuel Cell Laboratory.
The hydrogen fuel cell used has the following technical data:
-
GenCore Plug Power Fuel cell system 5B48 with an attached battery pack
-
Rated Net Output: 0 to 5,000W
-
Dimensions: 112cm x 66cm x 61cm
-
Weight: 227kg
-
The battery only operates to meet the fuel cells response time of ~1s and so draws very little power from the system.
-
Hydrogen fuel tanks stored at 175 bar
How is the fuel cell incorporated into the H2ool?
To find a relationship between fuel cell hydrogen consumption and power output, some experimental data has been carried out. The details can be found in the next paragraph.
Figure 9: Fuel Cell process
The Fuel Cell Lab Experimentation
To find the hydrogen consumption rate of a fuel cell at a variety of power outputs, a 35 minutes pre-defined load demand is placed on the fuel cell.
The load over time and the resulting hydrogen consumption rate over time can be seen in Figure 1.
It can be seen that the first 3 minutes the consumption is higher than the actual power output which can be explained as the whole system needs to start running. After that the H2 consumption follows the power output with a minor time delay.
To obtain a hydrogen consumption rate in order to size the fuel cell and the electrolyser, the H2 consumption rate dependent on the power output was displayed (Figure 2). It is assumed that the relationship between H2 consumption and power is linear which resolves in the following formula for the consumption rate:
y = 12.604x + 1.6068
where x = the power output in kW and y = the hydrogen consumed in Nm3/min. This formula is then be used in the calculation model to size the electrolyser and the power input for it.
Table 1: Predefined Load Profile


Figure 10: Variation of power and H2 usage over time from Hydrogen Lab

Figure 11: Hydrogen Consumption against power
Storage Research
How does the typical hydrogen storage look like?
Hydrogen storage can come in different forms. They can be categorised into Compressed, Metal Hydride and BoroHydrides. Since Metal Hydride and BoroHydrides are only partly commercially viable, for this system a compressed hydrogen storage has been chosen. The major advantage of compressed hydrogen cylinders is that they are economical and readily available (Fuelcell etc.,n.d.).
Typical commercially available sizes are shown in Figure 12 and some technical specifications in Table 2.
How is the storage incorporated into the H2ool?
The storage is set as being able to provide hydrogen for the day with the highest hydrogen requirement throughout the year. Additional 10% are added for safety.
Since a district electricity scheme requires a much bigger storage than the above shown ones, in this project the sizes are made tangible by comparing it to a whisky lorry (s. Figure 14).
The iterative search algorithm that intelligently takes the storage into account is explained .


Figure 12: Dimensions of commercially available hydrogen storages (BOC, n.d.)
Table 2: Specifications of commercially available hydrogen storages (BOC, n.d.)

Figure 14: Whisky lorry (PICSSR, n.d.)
Compressor Research
How does the compressor work?
Hydrogen is produced at low pressure and needs to be compressed before storage to minimise the volume that has to be stored. Compressors used for hydrogen compression are categorised into positive displacement compressors (reciprocating or rotary) or centrifugal compressors (Office of Energy Efficiency and Renewable Energy, n.d.). Considering the solar hydrogen system developed, a reciprocating compressor was chosen due to the high pressures of storage (200bar).
How is the compressor incorporated into the H2ool?
The compressor system was sized based on the power required by the electrolyser. The larger the electrolyser power, the greater amount of hydrogen that can be produced. It was estimated that the average compressor could handle 500kW of power, therefore this value is then divided into the total power requirement of the electrolyser.
Figure 15: Reciprocating Compressor (LinkedIn, n.d.)
Figure 15 shows the typical arrangement of this kind of compressor. The piston is driven by a crankshaft which can compress gases to very high pressures efficiently. The power required by the compressor is calculated using the formula below:
When large amounts of gas are required for compression, especially to high pressures, high exit temperatures can result. Incorporated into the calculation tool, the program calculates the exit temperature of the gas and determines the number of stages required in order to retain a low exit temp.

-
f = Flowrate of Hydrogen (M)
-
cp = Capacity at constant pressure (KJ/KgK)
-
cv = Capacity at constant volume (KJ/KgK)
-
y = cp/cv
Validation Procedure
In order to ensure the correctness and robustness of the H2ool including the used formulas and relationships, some validation processes have been carried out.
The following section shows how certain parts have been validated within the project process.
PV Area
The Trigonometric PV calculations have been validated with Suncalc.org and the National Oceanic and Atmospheric Administration (NOAA) sun calc, to ensure the suns position is modelled correctly.
The output of the PV panels has been validated using "MERIT".
Fuel Cell and Electrolyser
Typical conversion ratios for the fuel cell and electrolyser were acquired from the Scottish Hydrogen and Fuel Cell Association (SHFCA). For the fuel cell it takes 5-6 kg of hydrogen to produce 100kWh, and similarly it takes 50-45kWh of electricity to produce 1kg of hydrogen in a electrolyser. These ratios were then compared to the figures acquired through the H2ool.
As can be seen in Table 3, our conversion rates of both fuel cell and electrolyser are similar to the ones obtained from SHFCA.

Figure 15: SHFCA conversion ratios compared to H2ool system conversion rates
References:
Barbir, F. (2005). PEM electrolysis for production of hydrogen from renewable energy sources. Solar Energy, 78(5), pp.661-669.
BOC (n.d.) High Purity Hydrogen Cylinder. [online] Available at: https://www.boconline.co.uk/shop/en/uk/high-purity-hydrogen-cylinder and https://www.boconline.co.uk/internet.lg.lg.gbr/en/images/Hydrogen-factsheet410_116758.pdf [Accessed on 10/05/2018]
Clarke, J. and Kelly, N. (2017). Solar Energy. Script for courses ME922/ME927 at Strathclyde University Glasgow
energysage (n.d.). What are the most efficient solar panels on the market? [online] Available at: https://news.energysage.com/what-are-the-most-efficient-solar-panels-on-the-market/ [Accessed on 09/05/18]
Fuelcell etc. (2012). What Hydrogen Storage is Best for Me? [online] Available at: http://fuelcellsetc.com/2012/11/what-hydrogen-storage-is-best-for-me/ [Accessed:10/05/18]
Office of Energy Efficiency and Renewable Energy (n.d.). Gaseous Hydrogen Compression. [online] Available at: https://www.energy.gov/eere/fuelcells/gaseous-hydrogen-compression [Accessed on 10/05/2018]
PICSSR (n.d.) Chivasbrothers. [online] Available at: http://picssr.com/tags/chivasbrothers [Accessed on 10/05/18]
LinkedIn (n.d.) LinkedIn. [online] Available at: https://www.slideshare.net/julsaez/compressor-basis-10733805 [Accessed on 11/05/18]
Nel Hydrogen. (2018). Nel Electrolysers - Nel Hydrogen. [online] Available at: http://nelhydrogen.com/product/electrolysers/ [Accessed 11 May 2018].